Monday, April 22, 2019

Marketing Analytics Software Overview

Welcome back everyone! Today we are going to give you an overview of softwares that many people in the Marketing Analytics field use to better understand their audience and conduct statistical analyses. Some of the programs we will look at are: R, Tableau, Google Analytics, and Facebook Insights. While these are only a couple of platforms, there are still a plethora of others out there. I encourage viewers to go out and learn about the other programs, or ask your professors about these various softwares.

Without further ado, lets dive into these softwares!

R LogoR is a coding language for statistical analysis. Here many marketing analysts will utilize this software for data manipulation. Being able to code for statistics provides insight into identifying key subgroups for marketing efforts. Lets say you have a mailing list and also a customer spend list. Being able to link those two and create groups for targeting would allow your company to effectively market to a group that shares common spend, location, and other criteria. 

R is an open source software that anyone can pick up and start running analytics on! The website to download the program can be found here: https://www.r-project.org/

I have found that one of the best tutorials on R to be https://www.rstudio.com/online-learning/

They provide an in-depth look at R and lay a solid foundation into the world.

Tableau

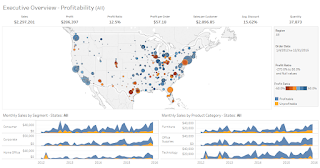
Tableau is a data visualization software that helps bring your analyses to life. This program will create storyboards to help you nail presentations to customers or higher ups. Throughout my college career I have used this software extensively. My job post graduation also uses tableau to help visualize data. Therefore, learning this software is imperative to a marketing analytics professional. Learning Tableau in college will give you a leg up on the competition. 

However, Tableau is unlike R in that it is a paid service. Your university might have a license for Tableau. The best tutorial out there is through the Tableau website: https://www.tableau.com/learn/training

Here Tableau provides much needed instruction on their software and the insight to effectively create visualization that will impress the bosses!

Google Analytics

Google Analytics provides insight on how your website is performing. From how many people have gone to each page of your website, to sales, conversions and time on your website, Google Analytics has become a necessary tool in better understanding on how customers interact with their website. With the evolution of the internet and increasing need for further understanding of people on the internet, Google Analytics is an essential tool. Therefore, taking their courses are a must to be officially certified in Google Analytics. You can find the basic certification here: https://analytics.google.com/analytics/academy/

Facebook Insights

For all your social media needs, Facebook Insights provide insights on your brand in social media. How your customers feel about your company and how many people are interacting with your social media. This includes mentions, pictures, and general keywords being talked about in relation to your brand. Marketing Analysts will use this software to better understand customers. From there, we can segment our audiences and push certain ads to them. This allows for more customized marketing which is proven to be the best practice. One tutorial I recommend is: https://blog.hootsuite.com/facebook-analytics-insights-beginners-guide/

The blog at hootsuite provides an in-depth look at Facebook Insights and how to best utilize them for your business! Many classes in college also cover Facebook and social media insights as the data in social media is endless!

Hope this post helps all the students trying to understand some of the incredibly useful programs that many Marketing Analysts use throughout the day to better understand their customers!

Monday, April 15, 2019

The Ideal Marketing Analytics Employee

Introduction

Now that you know what kind of jobs exist within the marketing analytics field and what the typical day looks like, you're probably wondering what employers are looking for in potential employees. There are a lot of ways to prepare for a job like a data scientist, and it doesn't necessarily have to be getting a data science related degree. There are plenty of ways to prepare yourself to stand out as a candidate in this field.

What kind of college degree?

Not all colleges offer actual data science or analytics majors. At Illinois State University, it is possible to major in marketing with a sequence in advanced analytical marketing. Even if you are not a marketing major, it is still possible to minor in analytics. Many of these classes will be marketing focused. More analytics related majors could be data science or computer science. If the college you are attending does not have a major or minor that pertains to analytics, there will most likely be a few analytics courses that you are able to take in order to start getting a feel for the field. If there aren't ANY analytics courses in your business school, there are still ways to start learning analytics online for free.

Certifications

These certifications offer ways for you to bolster your resume while learning valuable knowledge. All of the following courses are free to participate in online.

Google Analytics - One of the world's most popular web data tracking tools. Google offers free courses for people to begin learning to use their software. Users can start with getting their beginner certification before moving on to advanced. Upon completion, an actual certificate with your name on it will be awarded that can be shown to potential employers.

Hubspot - Software that works with sales and inbound marketing. Hubspot offers free lessons and a final test on their software to be rewarded with a certification.

Software Skills

Although not all of the following software are free or include certifications, employers typically look for some sort of experience in all/some of these when considering to hire a new employee in marketing analytics.

R - One of the most popular programming languages that is available for free. Although used as a foundational tool, many free plugins/add-ons can be installed to enhance the software. RStudio is one of the most common ways of making the software more user friendly. 

SAS - Advanced analytics software that can be downloaded to be used locally or used through cloud computing. SAS offers several methods of data mining.

SPSS - A statistics software that offers a user friendly way to run analyses such as KNN and regression. 

Tableau - Used primarily for data visualization. Tableau offers great ways of showing sales data across geographic locations.

Tuesday, April 2, 2019

A Day in the Life

Marketing analytics for the uninitiated sounds much more like a assemblage of buzzwords than profession. However, marketing analytics as a job field and as a career involves very real work. The difficulty of explaining it lies not with finding what it is involved in but rather what it isn't involved in. Instead of narrowing the search I will instead try to highlight some of the most important areas that employees find themselves in.

Refining Data

As discussed in previous posts, marketing analytics is search data for insights to drive marketing decisions. It should come at no surprise then that analysts can see whole days swallowed up by data cleaning. Data cleaning is simple taking the data in it's raw form and tweaking, shrinking, and refining it enough to be analyzed. This step requires many hours in a variety of programs doing things such as throwing out incomplete entries, clearing up errors, removing unnecessary data and so on.
example of SPSS
Figure 1-SPSS

Searching for Insights

After the Data has been cleaned it is then run through a variety of software and models depending upon the user, goal, and resources. Picking the model is as important as picking the right software for the job. A program like Tableau is excellent for visualizing and presenting the data. Meanwhile a program such as SPSS can be used for raw statistical insights such as regression.

Show and Tell

One of the most unique aspects of a marketing analytics professional's day is linking traditional marketing with the in depth data analysis process mentioned above. Insights and discoveries have no value if they cannot be explained to and applied by those on the marketing side. Marketing analysts must not only explain what has been discovered in the data but also how it can be used. In many ways
Tableau Visualization
Figure 2-Tableau offers many features for visualizing data
marketing analytics professionals are ambassadors for the larger world of analytics and data 

Though this a reductive view of the field and there are countless nuances in any area of employment I hope this helps crystallize what someone involved in marketing analytics might spend their day doing.


Figure 1
Figure 2

Reflecting on our Time at ISU

Reflections Now that is time for the blog to come to a close, each member of the group wanted to take time to reflect on the past semeste...